(This is part X of this series on energy. We hope it helps the reader better understand the issues facing our country and our state as we endeavor to tackle the problem of providing our citizens and our businesses with their energy needs.)
COMPETING OBJECTIVES
* Choosing between different forms of energy often involves tradeoffs between competing objectives, such as affordability, environmental impacts, and energy security. These tradeoffs can sometimes be impossible to objectively quantify.[873] [874] [875] [876] [877]
* A 2008 Harris poll of 1,020 U.S. adults found that 92% favored “a large increase in the number of wind farms.”[878] The same poll found that among 787 U.S. adults who pay household energy bills:
- 40% were not willing to pay anything more for energy from renewable sources.
- 48% were willing to pay at least 5% more.
- 31% were willing to pay at least 10% more.
- 14% were willing to pay at least 15% more.
- 7% were willing to pay at least 20% more.
- 3% were willing to pay at least 30% more.
- 1% were willing to pay at least 40% more.[879]
* In 2015, the U.S. Energy Information Administration (EIA) projected that the levelized cost of electricity generated by new onshore wind power in 2020 will be 1% higher than that from advanced combined cycle natural gas [Adv CC], and the cost of photovoltaic [PV] solar will be 73% higher than Adv CC.[880] Per EIA, these levelized costs “significantly understate the advantage of Adv CC relative to onshore wind … while overstating the advantage of Adv CC relative to solar PV….”[881] See the section above on the costs of electricity for extensive details about comparing the costs of electricity generating technologies.
* A 2010 Rasmussen poll of 1,000 likely voters found that:
- 56% were not willing to pay more taxes or higher utility costs to “generate cleaner energy and fight global warming.”
- 37% were willing to pay at least $100 more per year.
- 18% were willing to pay at least $300 more per year.
- 8% were willing to pay at least $500 more per year.
- 5% were willing to pay at least $1,000 more per year.
- 2% were willing to pay in excess of $1,000 more per year.[882]
* During 2015, the average cost of ethanol without federal subsidies was 38% higher than gasoline, and the average cost of biodiesel without federal subsidies was 118% higher than gasoline.[883]
* Per a 1992 EIA report:
Subsidies
* “Subsidies,” as defined by the U.S. Government Accountability Office, are “payments or benefits provided to encourage certain desired activities or behaviors.”[885] Per the U.S. Energy Information Administration (EIA), subsidies “stimulate the production or consumption of a commodity over what it would otherwise have been.”[886]
* EIA classifies government energy subsidies into two main categories: direct and indirect. Direct subsidies have explicit effects on government budgets, while indirect subsidies do not. For instance, tax breaks for the production of certain energy products are direct subsidies because they produce readily identifiable changes in tax revenues. In contrast, government mandates that require the use of certain energy products are indirect subsidies because the effects don’t appear as line items in government budgets, but they still impact energy consumers and producers.[887][888] [889]
* Reasons provided for enacting energy subsidies include but are not limited to:
- promoting forms of energy that create less pollution or greenhouse gases.[890] [891]
- correcting for the “energy paradox,” an “empirical observation that consumers require an abnormally high rate of return to undertake energy-efficiency investments.”[892]
- increasing the stability of a nation’s energy supply by promoting domestic sources of energy over those controlled by hostile or unstable foreign governments.[893] [894]
- paying energy bills for low-income households.[895]
* Ancillary consequences of government energy subsidies include but are not limited to:
- increased energy costs,[896] [897] [898] [899] which reduce economic growth and leave people with less money “to satisfy basic needs for food, shelter, clothing, education, and health.”[900] [901]
- increased energy consumption caused by lowering the price of energy at the point of sale (though not necessarily the overall cost), which decreases consumers’ incentive to conserve energy.[902] [903] [904]
- increased food prices that augment hunger, particularly in poor nations.[905] [906] [907]
- increased emissions of certain pollutants.[908]
- increased taxes and/or government debts that exceed the benefits of the subsidies.[909] [910] [911] [912]
- the government “paying firms or households to make choices about investment, production, or consumption that they would have made without the subsidies. For example, tax credits for energy-efficient windows might go to homeowners who would have purchased them anyway.”[913]
- guaranteeing corporations double-digit profits on certain energy projects,[914] transferring the risks of their investments to the public,[915] and supplying them with funds used for executive bonuses shortly before they declare bankruptcy.[916]
* Forms of energy subsidies include but are not limited to:
- giving money to producers and consumers of certain energy products.[917] [918]
- offering preferential tax treatments to producers and consumers of certain energy products.[919] [920]
- mandating that consumers and producers use specified amounts of certain energy products.[921] [922] [923][924]
- purchasing through government agencies certain energy products that are significantly more expensive than other alternatives.[925] [926]
- providing loans for energy projects that are unable to obtain private financing due to the risk of default, or guaranteeing to pay the loans in the event of default.[927] [928]
- spending money on research and development for certain energy products.[929] [930]
* Examples of subsidies for:
- coal include direct federal subsidies totaling $1.4 billion in 2010, with 49% of this going to the U.S. Department of Energy to conduct research primarily aimed at reducing greenhouse gas emissions.[931] [932] [933] Another 41% of these subsidies were for tax preferences, with 61% of this going to clean coal facilities and pollution control equipment.[934]
- renewables in general include 679 federal initiatives that support solar, wind, biofuel, geothermal, hydropower, ocean, or waste conversion energy.[935] In 2010, direct federal subsidies for renewables amounted to $14.7 billion.[936] As an example of an indirect subsidy, thirty states and the District of Columbia require utilities to generate or obtain specified portions of their electricity from renewable sources.[937]
- solar include direct federal subsidies including cash grants, tax preferences, research and development [R&D] expenses, and loan guarantees totaling $1.1 billion in 2010.[938] The states of California and Arizona have forced utilities to purchase electricity from customers with solar panels at rates that don’t account for the transmission or distribution costs of this energy. This pushes these costs, which amount to about 40% of the typical electricity bill, onto other customers.[939] [940] [941] [942] [943]
- wind include direct federal subsidies totaling $5.0 billion in 2010, with 97% of this coming from the American Recovery and Reinvestment Act of 2009 (a.k.a. Obama stimulus).[944] The most prominent of these subsidies is a renewable energy tax credit/grant that is twice as high for wind, geothermal, and certain biofuels than it is for other renewable energy sources.[945] [946] [947]
- biofuels include the EPA’s Renewable Fuel Standard program, which “generally requires the volume of biofuels used in the transportation sector … to increase through 2022 to an annual total of 36 billion gallons.”[948] (For a point of reference, the U.S. transportation sector consumed 99 billion gallons of gasoline in 2009.[949]) This subsidy was enacted to “encourage the domestic production of ethanol and other biofuels” and to reduce “greenhouse-gas emissions from the transportation sector.”[950]
- natural gas and petroleum include direct federal subsidies totaling $2.8 billion in 2010, with 95% of this coming from tax preferences.[951] The largest of these (comprising 36% of the preferences) is called “percentage depletion,” a tax break on properties mined for natural resources such as oil, gas, coal, minerals, uranium, and geothermal steam. Since 1975, major oil and gas companies have been excluded from this tax preference, and the primary beneficiaries are small independent companies and property owners. The purpose of this subsidy is to maximize the yield of resources from each property.[952] [953] [954] [955] [956]
- energy conservation/efficiency include direct federal subsidies totaling $6.6 billion in 2010, with 51% this going to cash payments and 49% to tax preferences. The largest of these (comprising 48% of total subsidies) is a tax preference for installing energy-efficient windows, furnaces, boilers, roofs, doors, etc. in existing homes.[957]
- nuclear include direct federal subsidies totaling $2.5 billion in 2010, with 47% of this going to R&D. Of these R&D subsidies, the largest item (comprising 34% of total R&D subsidies) is for the environmental cleanup of government-sponsored nuclear research facilities. Although EIA classifies the environmental cleanup of “nuclear weapons development and government-sponsored nuclear energy research” facilities as subsidies for “non-defense environmental cleanup,” EIA has explained that these are not subsidies in the true sense of the word.[958] [959] [960] [961]
* As of May 2016, neither EIA nor the Congressional Budget Office (CBO) has published annual historical data providing a comprehensive and consistent measure of direct federal energy subsidies.[962] [963] [964] [965] EIA has published such data for certain years, although the level of detail varies, and definitions of what constitutes direct subsidies are not always consistent.[966] CBO has published data on federal energy-related tax preferences going back to 1977. These EIA and CBO data are reviewed below. They do not account for:
- state and local subsidies.
- federal indirect subsidies, such as mandates that force energy producers and consumers to use specified amounts of certain energy products, and federal agencies that purchase certain energy products that are more expensive than other alternatives.
- federal tax preferences that are generally available to wide-ranging industries.
- federal energy subsidies that have negligible value.[967] [968] [969] [970]
* Per EIA, energy subsidies in the range of one percent of total energy sales are “in general, too small to have a significant effect on the overall level of energy prices and consumption in the United States.”[971] Likewise, per EIA, “market impacts are negligible” for “programs that offer small subsidies for products for which there are huge existing markets….”[972]
|
Year |
Direct Federal Energy Subsidies as a Portion of Total Energy Sales |
| 1990[973] |
1-2% |
| 1999[974] |
0.7% |
| 2007[975] |
1.4% |
| 2010[976] |
3.1% |
| 2013[977] |
2.1% |
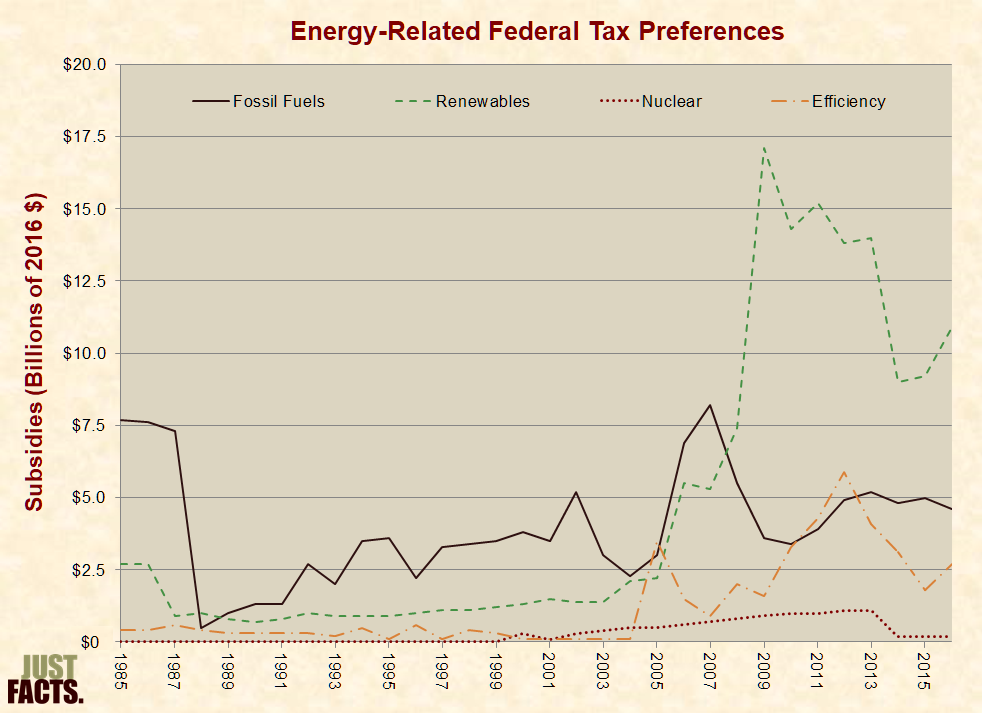
* From 1985 through 2015, inflation-adjusted federal tax preferences for:
- fossil fuels averaged $3.9 billion per year.
- renewables averaged $4.4 billion per year.
- energy efficiency averaged $1.2 billion per year.
- nuclear averaged $0.3 billion per year.[980]
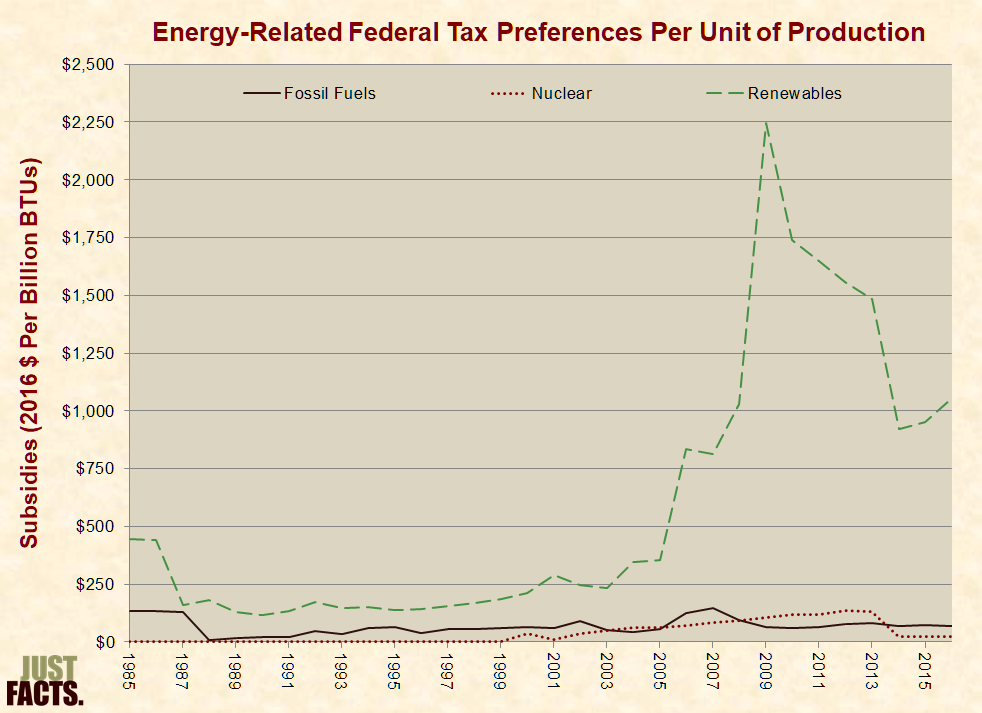
* Per EIA, “some forms of energy receive subsidies that are substantial relative to” the energy they produce, and thus, a “per-unit measure” of energy subsidies “may provide a better indicator of its market impact than an absolute measure.”[982] [983] For example, in 2010, coal received federal electricity production subsidies totaling $1,189 million, while solar received $968 billion.[984] However, coal produced 44.9% of the nation’s electricity, and solar produced 0.1%.[985] [986]
* From 1985 through 2015, federal tax preferences per unit of primary energy production for:
- renewables averaged $563 per billion BTUs.
- fossil fuels averaged $67 per billion BTUs.
- nuclear averaged $38 per billion BTUs.[987]
* Aggregating energy subsidies into broad categories (like fossil fuels and renewables) can obscure their nature, because specific components of these broad categories sometimes receive relatively large portions of the subsidies. Per EIA, federal energy subsidies are often “targeted at narrow segments of the energy industry” and provide “relatively large payments to producers using specific energy technologies that otherwise would be uneconomical.”[989] [990] For example:
- Under a previous federal subsidy enacted to ease dependence on foreign oil, “institutional investors such as insurance companies, banks, utilities, and large corporations with substantial net revenues” reduced their tax burdens by billions of dollars through a tax preference for “synthetic coal.” When this subsidy ended in 2007, “none of the 59 coal synthetic plants … remained profitable and all ceased production at the end of 2007.”[991][992] [993] [994] [995]
- In 2012, the U.S. Navy procured 450,000 gallons of biofuels for its “Great Green Fleet” program. These fuels (made from used cooking oil and algae) cost $26.75 per gallon, while conventional fuel cost $3.60 per gallon.[996] [997] [998] [999]
- In 2010, hydropower received 3% of all renewable electricity subsidies while producing 60% of all renewable electricity. In comparison, wind received 76% of all renewable electricity subsidies while producing 22% all renewable electricity, and solar received 15% of all renewable electricity subsidies while producing 0.6% of all renewable electricity.[1000]
* EIA has published comprehensive accountings of direct federal energy subsides for 1992, 1999, 2007, 2010, and 2013. Only the last three of these accountings disaggregate subsidies for specific renewables, like wind, solar, and biofuels.[1001] [1002] [1003] [1004] [1005] Combining this data with EIA’s primary energy production data reveals the following levels of per-unit energy subsidies: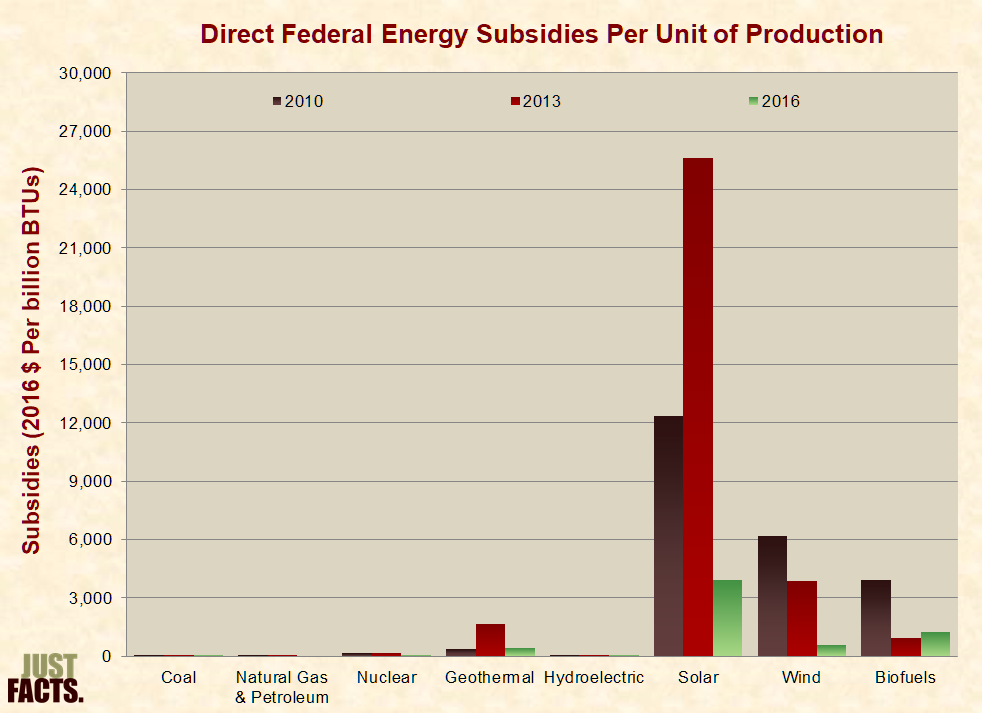
* Per EIA, there can be considerable lag times between subsidies and their effects on energy production. Thus, subsidies divided by production in any given year are not always representative of the larger picture. For example, many subsidies during 2007-2010 were provided to facilities still under construction as of 2011. Also, subsidies for research and development (R&D) of new technologies can take “many years” to yield results.[1007] However, EIA has noted that the outcomes of R&D subsidies are “inherently uncertain,” and:
- “Several studies suggest that the return on overall Federal R&D investment is much lower than the return on private-sector R&D, implying relatively high failure rates.”
- “Much of what is defined as energy R&D in the Federal government’s budget accounts is not directly expended on energy research or development. Rather, a portion of the funds are expended on environmental restoration and waste management associated with the byproducts of energy-related research facilities, e.g., nuclear waste disposal.” (Note that such subsidies are for government facilities; the owners of commercial nuclear power plants must pay for nuclear waste disposal.[1008] [1009])
- “The creation of a Federally-funded R&D program could, under some circumstances, displace private-sector R&D. In that case, the Federal program would not produce new knowledge that could not be developed by the private sector, but would simply reduce private R&D costs.”[1010] [1011] [1012] [1013] [1014] [1015]
To be continued…….
Email this author


