(This is the third in a series that brings to the reader some basic facts about energy so that he/she can better understand the raging debate over energy supplies and environmental stewardship.)
Costs of Electricity
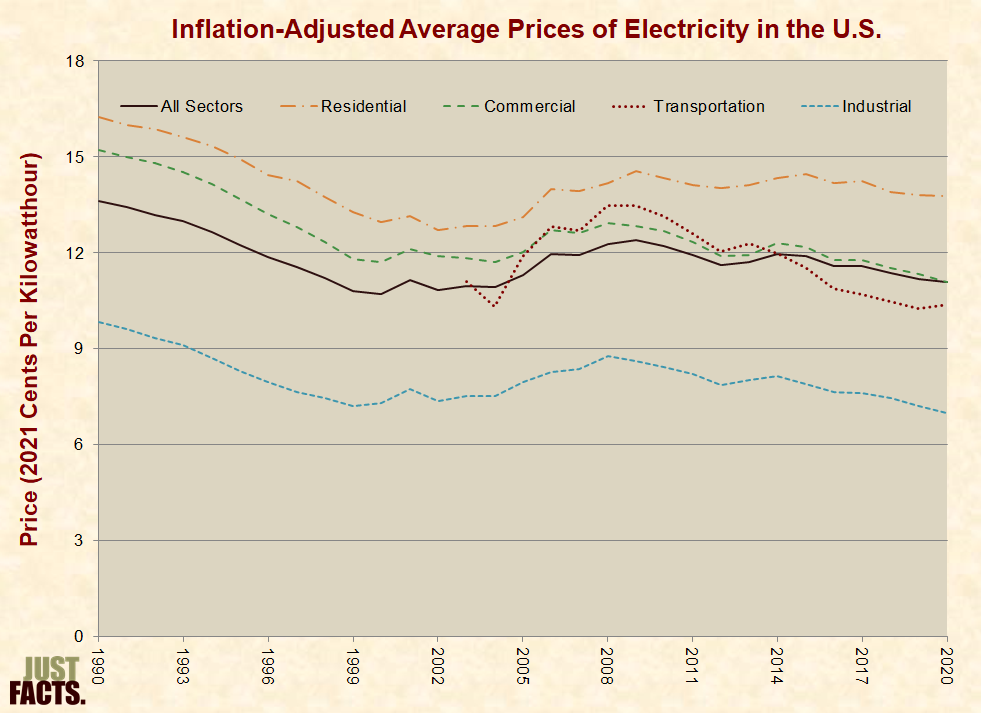
From 1929 to 1967, the inflation-adjusted average price of electricity for U.S. residential customers declined from about 60 cents per kilowatt hour to 10 cents, and it stayed roughly around this figure through 2012.[159]
* The inflation-adjusted average prices of electricity since 2004 for all U.S. consumers and the four major energy sectors are shown in the graph below:
* Demand for electricity varies on an hourly, daily, and seasonal basis due to factors such as:
- The time of the day, which influences the usage of lighting, computers, and other electric devices.
- The weather, which influences the usage of heating, air conditioning, and ventilation systems.[161] [162] [163]
* As shown in the following graph, the terms “baseload” and “peak load” are used to describe the minimum and maximum demands for electricity over a given time period. The term “intermediate load” is used to describe the range between them.[164] [165]
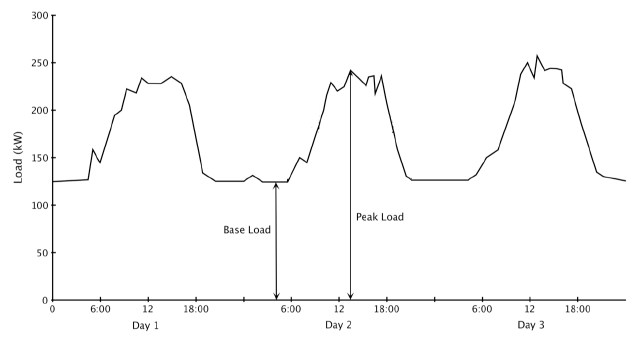
- Coal is the dominant energy source for generating baseload capacity, because low fuel costs make coal plants inexpensive to run continuously, which is ideal for generating baseload capacity. For the same reason, nuclear power is a primary source of baseload capacity. Natural gas, hydropower, geothermal, and waste-to-energy plants are also sources of baseload capacity.[167] [168] [169] [170]
- Natural gas is the dominant energy source for generating intermediate and peak load capacity because natural gas power plants can ramp up and down quickly, which is ideal for intermediate and peak load capacity.[171] [172] [173] [174]
- In 2009, natural gas became competitive with coal for generating baseload capacity in some areas of the U.S. This was primarily due to increased domestic natural gas production, which reduced prices. Other factors included increased coal prices, stricter environmental regulations, and expansion of natural gas pipelines.[175] [176] [177] [178]
- In 2012, both coal and natural gas fuels were competitive for generating baseload capacity under differing circumstances in different regions of the U.S.[179]
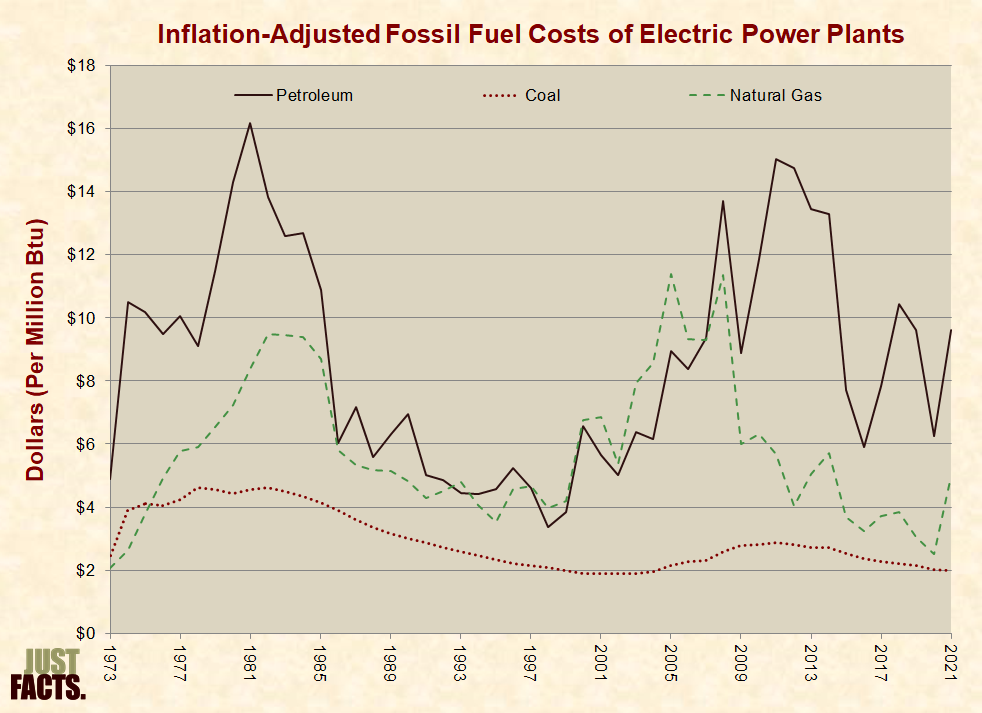
- For existing power plants, natural gas plants that employ a high efficiency technology called “combined cycle” can generate baseload power less expensively than coal plants when natural gas is about 1.5 times the price of coal.[180] [181] [182] In 2015, the average energy-equivalent price paid by electric power plants for natural gas was about 1.5 times the price of coal.[183]
- Per the U.S. Energy Information Administration (EIA), electric utilities and government entities that regulate them:
Forecast the demand for electricity at the time of the peak, and then identify existing and potential generating resources needed to satisfy that demand, plus enough additional resources to provide a comfortable reserve margin. The goal is to minimize the costs associated with new capacity investments while ensuring reliability for customers.[186] [187] [188]
Determining which electricity-generating technologies will provide the lowest cost while maintaining reliability is complicated by the following factors:
- Power plants are capital-intensive and have lifespans measured in decades. Because these are long-term investments, there is ample time for market conditions and government energy polices to change, and this creates risk.[189] [190] [191] [192] [193] [194]
- Utilities must produce enough electricity to meet their customers’ demands on a second-by-second basis, and the costs of generating this electricity vary depending upon when it is produced. During periods of high demand, electricity is more expensive to generate. Thus, technologies that generate electricity on demand have more value to utilities than intermittent resources, such as wind and solar.[195] [196] [197] [198] [199] [200] [201]
- Decisions to invest in new generating capacity frequently involve factors that are unique to each utility and each point in time.[202]
* A commonly cited measure of the costs of building and operating new power plants is the “levelized cost” data published by EIA. Levelized costs reflect “both the capital and operating costs of deploying and running new utility-scale generation capacity of any given type.”[203] [204] Per EIA:
- The direct comparison of LCOE [levelized cost of electricity] across technologies to determine the economic competitiveness of various generation alternatives is problematic and potentially misleading.”[205] [206]
- The following features, caveats, and limitations are inherent in EIA’s levelized costs:
- They remove the effects of government subsidies.[207]
- They account for the costs of buying or leasing land to operate the generation facilities.[208]
- They do not measure actual costs but are projections of future costs.[211]
They vary with EIA’s assumptions:
-
- In 2011, EIA reduced the projected 2016 levelized cost for wind by 35% below its projection from one year earlier.
- They do not provide a comprehensive projection of future costs, because they estimate the cost of building and operating one new power plant of each technology. Beyond that, the prices of geothermal, wind, and hydropower are subject to change.[215]
- EIA does not have a monitoring and feedback mechanism to test the accuracy of previous projections.[216]
- The projections do not account for the fact that intermittent electricity is less valuable than electricity that can be dispatched on demand. Per EIA, the levelized costs for wind and solar “are not directly comparable to those for other technologies” and are therefore “listed separately in the tables, because caution should be used when comparing them to one another.”[217] [218] [219]
- They do not account for the physical lifespan of different capital investments. Instead, they assume that all types of generation capacity have the same financial life (30 years).[220] [221] Differing technologies have different physical lifespans:
-
- The majority of nuclear power plants have been licensed to operate for 60 years.[222]
- Per a 2008 Congressional Budget Office report, “numerous power stations built in the first half of the previous century are still in use.”[223] [224]
- Per a 2013 report commissioned by EIA, solar panels have an expected life of 20-30 years.[225]
- They add a 3-percentage premium to the financing costs of coal power plants to account for risks that government may tax or regulate greenhouse gases.[226] In 2013, this increased EIA’s projected 2018 levelized cost for coal by 19%.[227]
- They do not compare the costs of replacing existing capacity with new capacity. Unless the costs of building and operating new capacity are lower than the costs of operating existing capacity, there is an economic disincentive to displace existing plants.[228] [229]
- They only analyze utility-scale systems.[230] Rooftop solar systems, which are typically installed on homes and commercial buildings, are more expensive than utility-scale systems. This is because utility-scale systems benefit from economies of scale.[231] [232]
In 2015, EIA projected the following levelized costs for plants that begin generating electricity in 2020:
|
Plant type (lowest cost option from each major category) |
Cost (2013$/megawatthour) |
Cost Increase Relative to Natural Gas |
|
Dispatchable Technologies |
||
| Natural Gas Advanced Combined Cycle |
72.6 |
0% |
| Geothermal |
47.8 |
-34% |
| Conventional Coal |
95.1 |
31% |
| Advanced Nuclear |
95.2 |
31% |
|
Non-Dispatchable Technologies |
||
| Onshore Wind |
73.6 |
1% |
| Hydropower |
83.5 |
15% |
| PV Solar |
125.3 |
73% |
* Per EIA, “a better assessment of economic competitiveness can be gained through consideration of avoided cost, a measure of what it would cost the grid to generate the electricity that is otherwise displaced by a new generation project, as well as its levelized cost.” Calculating these costs involves a greater degree of complication than levelized costs.[234] [235]
* In July 2013, EIA published a preliminary discussion paper using avoided costs and levelized costs to compare the projected 2018 and 2035 values of advanced combined cycle natural gas (Adv CC), onshore wind, and PV solar with different subsidies given to wind and solar.[236] Because there is significant variability in factors that affect electricity costs and values in different regions of the country, the paper contained assessments of 22 regions within the U.S. electricity system. It found that without subsidies for wind and with a 10% investment tax credit for solar:
- In 2018, the projected economic value of the wind and solar systems is “negative and significantly below” natural gas advanced combined cycle projects “in all regions.”
- By 2035, the economic value of onshore wind is positive in 6 of 20 regions where the technology can be built, and in 3 of 21 regions for solar PV (with 5 additional regions close to breakeven).”
- “Direct comparison of LCOE values significantly understate the advantage of Adv CC relative to onshore wind in terms of economic value in all regions, while overstating the advantage of Adv CC relative to solar PV….”
- “Solar LCOE remains substantially higher than wind LCOE throughout the projection period….”[237]
* The following features, caveats, and limitations are inherent in this analysis:
- It is based on projections of changing future economic conditions, such as rising natural gas prices starting around 2025.[238] [239]
- It does not provide an analysis of solar without the effect of government subsidies.[240]
- It does not remove the effects of existing taxes or government regulations.[241] [242]
It does not provide a comprehensive projection of future costs, because it estimates the cost of building and operating one new power plant of each technology. Beyond that, the prices of geothermal, wind, and hydropower are subject to change.[243]
- It does not account for the physical lifespan of different capital investments. Instead, it assumes that all types of generation capacity have the same financial life (30 years).[244]
- It only analyzes utility-scale systems.[245] Rooftop solar systems, which are typically installed on homes and commercial buildings, are more expensive than utility-scale systems. This is because utility-scale systems are larger and benefit from economies of scale.[246] [247]
* In 2015, EIA used levelized costs and avoided costs to estimate which type of plants would be economically competitive to build and begin producing electricity in 2020. Positive values indicate an economic incentive to build, and negative values indicate a disincentive:[248]
|
Plant type (lowest cost option from each major category) |
Incentive (Levelized Minus Avoided Costs) |
Incentive Relative to Natural Gas |
|
Dispatchable Technologies |
||
| Natural Gas Advanced Combined Cycle |
-1 |
0 |
| Geothermal |
27 |
28 |
| Conventional Coal |
-24 |
-23 |
| Advanced Nuclear |
-23 |
-22 |
|
Non-Dispatchable Technologies |
||
| Onshore Wind |
-9 |
-8 |
| Hydropower |
-14 |
-13 |
| PV Solar |
-34 |
-33 |
- Forest product companies often use byproducts from their operations to generate their own electricity.[250] During 2015, wood generated 1.0% of all electricity in the U.S., as compared to 0.9% for solar and 0.4% for geothermal.[251]
- Oil and biofuels are rarely used to create electricity, because they are significantly more costly than the major sources of electricity.[252] [253] In 2015, the average energy-equivalent price paid by electric power plants for petroleum was about 3.1 times the price of coal.[254]
Petroleum
-
- Petroleum is a class of fossil fuels that are generally liquid at atmospheric pressure, although broader definitions of the term also include some gases and solids. The terms “petroleum” and “crude oil” are sometimes used synonymously, although petroleum is typically defined to include several other types of fossil fuels.[255] [256]
- Petroleum is primarily comprised of organic compounds called hydrocarbons, which consist of carbon and hydrogen. Other common elements of petroleum are nitrogen, oxygen, and sulfur.[257] [258] [259]
- Petroleum is mainly thought to be formed of diverse marine organisms that were buried by sediments and transformed by heat, pressure, and time.[260] [261] [262]
The first oil well was drilled in 1857, the first intercontinental oil shipment occurred in 1859, and the first modern oil refinery commenced operations in 1862. By the 1870s, “refineries, tank cars, and pipelines had become characteristic features of the industry,” and by 1874, U.S. crude oil production had grown to 10 million barrels per year.[263]
Today, the vast majority of crude oil is transported via pipelines and ships, and most refined petroleum fuels are transported from refineries to wholesale terminals through pipelines. Pipelines are the safest and most economical means of transporting petroleum in the U.S.[264] [265] [266] [267] [268]
Petroleum is used to manufacture wide-ranging products, such as gasoline, diesel fuel, jet fuel, heating oil, lubricants, asphalt, propane, synthetic fabrics, plastics, paints, fertilizers, and soaps.[269] [270] - In 2015, petroleum supplied:
- 35% of all primary energy consumed in the U.S.
- 92% of primary energy consumed in the transportation sector.
-
- 39% of primary energy consumed in the industrial sector (not including energy purchased from electric power utilities).
- 15% of primary energy consumed in the residential and commercial sectors (not including energy purchased from electric power utilities).
- 1% of primary energy consumed in the electric power sector.[271]
Consumption, Production, Imports, and Prices
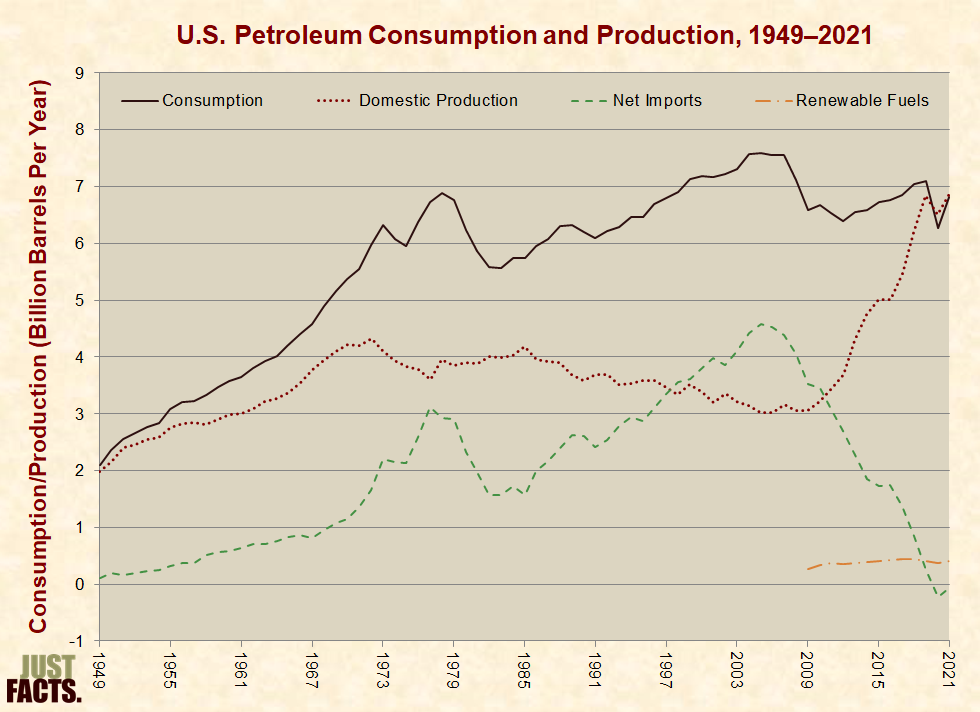
- In 2015, the U.S. consumed about 6.7 billion gallons of petroleum, 25% of which was imported.[272]
- U.S. petroleum consumption and net imports have declined since the mid-2000s, primarily due to the economic recession, increases in domestic crude oil production, use of renewable fuels, and efficiency improvements:[273] [274]

- In 2014, U.S. net petroleum imports were distributed as follows:
- 61% came from countries in the Western Hemisphere and 37% from the Persian Gulf.[276]
- Among the top five countries, 51% came from Canada, 23% from Saudi Arabia, 14% from Venezuela, 7% from Iraq, and 6% from Russia.[2 77]
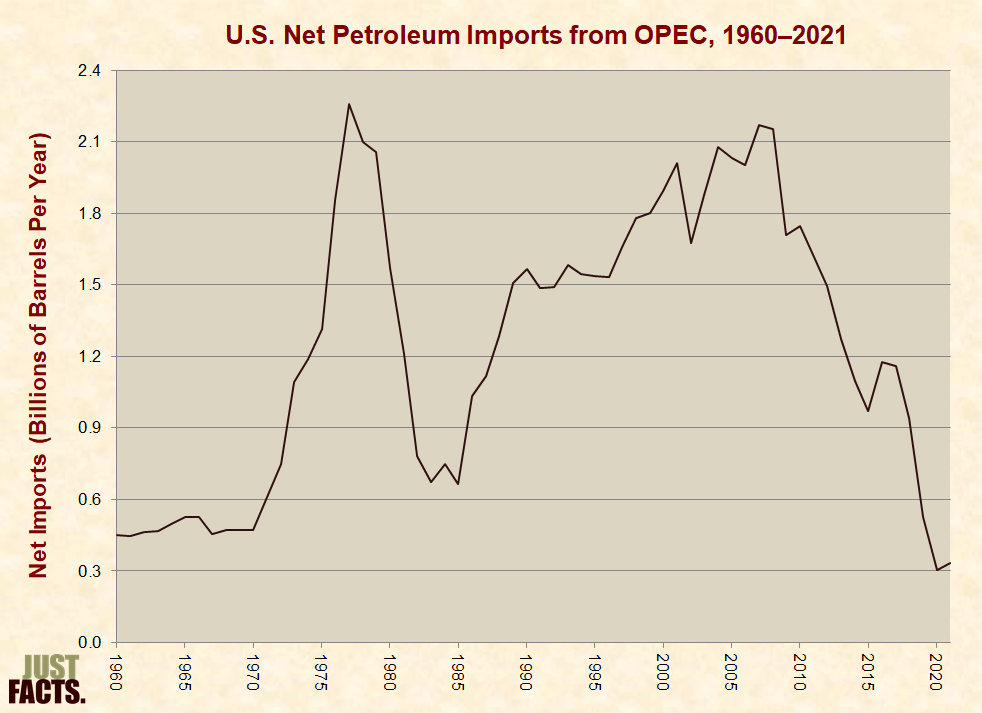
- 59% came from nations that are members of the Organization of the Petroleum Exporting Countries (OPEC),[278]
- An intergovernmental body formed to “coordinate and unify the petroleum policies of its member countries.”[279] OPEC members include: Algeria, Angola, Ecuador, Indonesia, Iran, Iraq, Kuwait, Libya, Nigeria, Qatar, Saudi Arabia, United Arab Emirates, and Venezuela.[280]
* Since OPEC’s founding in 1960, its member nations have adopted various strategies to exert control over the petroleum market. One of their more common strategies has been to limit their petroleum production in order to boost prices and increase their profits.[281] [282] [283]
* OPEC nations have also adopted the opposite strategy of maximizing their petroleum production in order to drive down prices, force their competitors out of business, and grow their market share. Some OPEC nations have recently done this in response to increased production from non-OPEC countries.[284] [285] [286] [287] [288] [289]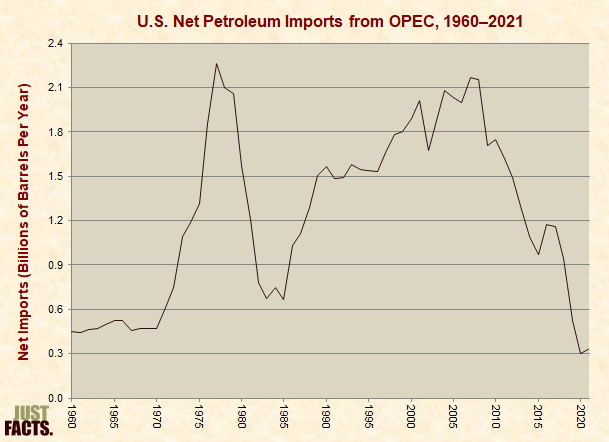
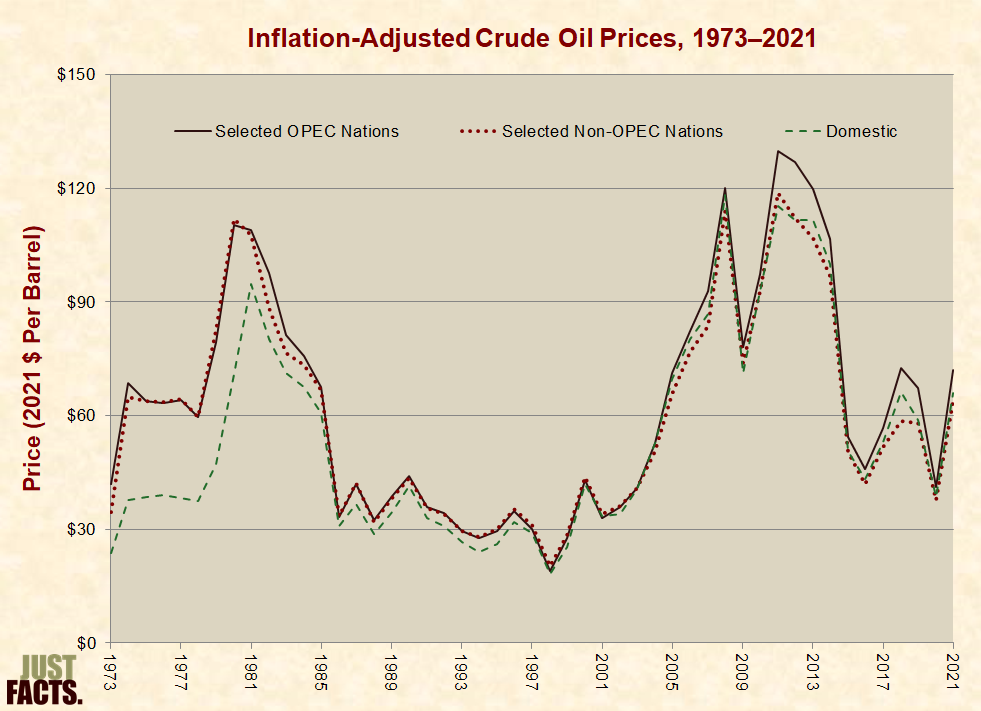
* Crude oil prices are affected by global and local factors that impact the supply of petroleum and the demand for petroleum products, such as economic growth and recessions, OPEC policies, political unrest, and technological advancements.[291] [292] [293] [294]
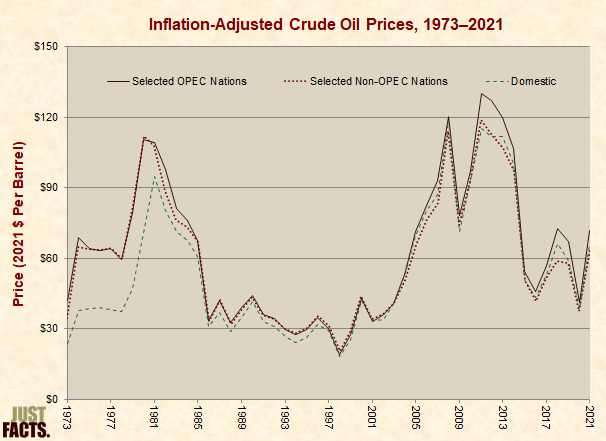
* In the U.S. during 2015, the average landed (i.e., delivered) price of crude oil from selected OPEC nations was 8% more than the average price of domestic crude, and the average landed price of crude from selected non-OPEC nations was 1% less than the average price of domestic crude.[296]
* In 2015, the average retail price of a gallon of regular-grade gasoline in the U.S. was $2.42. Crude oil accounted for 48% of this price, refining costs and profits accounted for 19%, federal and state taxes accounted for 19%, and distribution and marketing accounted for 14%.[297]
Extraction Methods
* Crude oil resources[298] can be grouped into four major categories based upon their accessibility:
- tight oil (sometimes called shale oil[301] [302] [303]), which is located in semi-porous or non-porous rocks that don’t allow the oil to freely flow when accessed through drilling. This type of petroleum can be extracted by using a combination of technologies known as horizontal drilling and hydraulic fracturing (described below).[304] [305] [306]
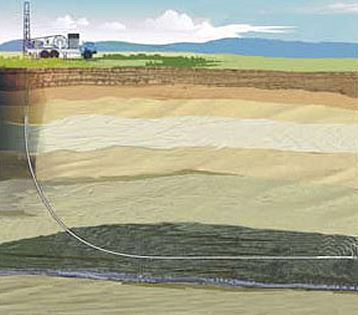
* Horizontal drilling involves penetrating the ground vertically (like traditional drilling) and then turning horizontally in order to drill along the layer that contains the fossil fuel resources. This method of drilling exposes more of the fossil fuel resources to the bore of each well, thus increasing yields, decreasing the surface footprint of drilling operations, and decreasing unwanted output from the wells, such as water.[313] [314]
* Horizontal drilling was first successfully employed in 1929 and has been used commercially since the late 1980s. By 1990, more than 1,000 horizontal wells were drilled worldwide, roughly 85% of which were in Texas.[316]
* Hydraulic fracturing or fracking involves injecting fluids at high pressures from the bore of the well into the layer that contains the fossil fuel resources. This process creates fractures in the rock, which allows oil to flow to the bore of the well. The fluids used for fracking typically contain sand or ceramic beads that serve to hold open the fractures after they have been created. This fluid also contains varying chemicals that are used for purposes such as reducing friction and preventing pipe corrosion.[317] [318] [319] (A detailed description of the process is shown in the video below.)
* Hydraulic fracturing was first successfully employed in 1947 and has been used commercially since the 1950s. By 1955, more than 100,000 fracking treatments were performed.[320]
* Since the mid-2000s, technological advancements and market conditions have made it economically worthwhile to extract tight oil by using a combination of horizontal drilling and hydraulic fracturing.[321] [322] [323] [324] [325] [326] The process is shown in this video:* From 2005 to 2015, U.S. crude oil production increased by 65%, primarily due to the use of horizontal drilling coupled with hydraulic fracturing in tight oil formations.[327] [328] [329] [330] [331] [332]
* As of 2015, horizontal drilling coupled with hydraulic fracturing had not been widely used to extract tight oil outside the U.S.[333] [334] [335] [336] [337] In 2013, the U.S. Energy Information Administration (EIA) estimated that 10% of worldwide technically recoverable oil resources are located in tight formations.[338]
* For facts about the environmental impacts of horizontal drilling and hydraulic fracturing, visit the politics section of this research.
….To be continued…