Hydropower
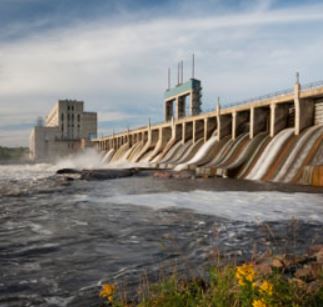
* Hydropower is generated by harnessing the energy of moving water. Hydroelectric power plants typically channel water through turbines, thus causing them to spin and produce electricity.[758] [759] [760] [761]
* More than 2,000 years ago, the ancient Greeks used hydropower to grind corn, pump water, and power other types of machinery. The world’s first hydroelectric power plant was built in Appleton, Wisconsin (U.S.A.), and became operational in 1882.[762] [763] [764] [765]
* Hydropower output typically varies from year to year, because it is dependent upon rainfall and other elements of climate and weather.[766] In 2015, hydropower supplied 2.4% of all primary energy consumed in the United States:
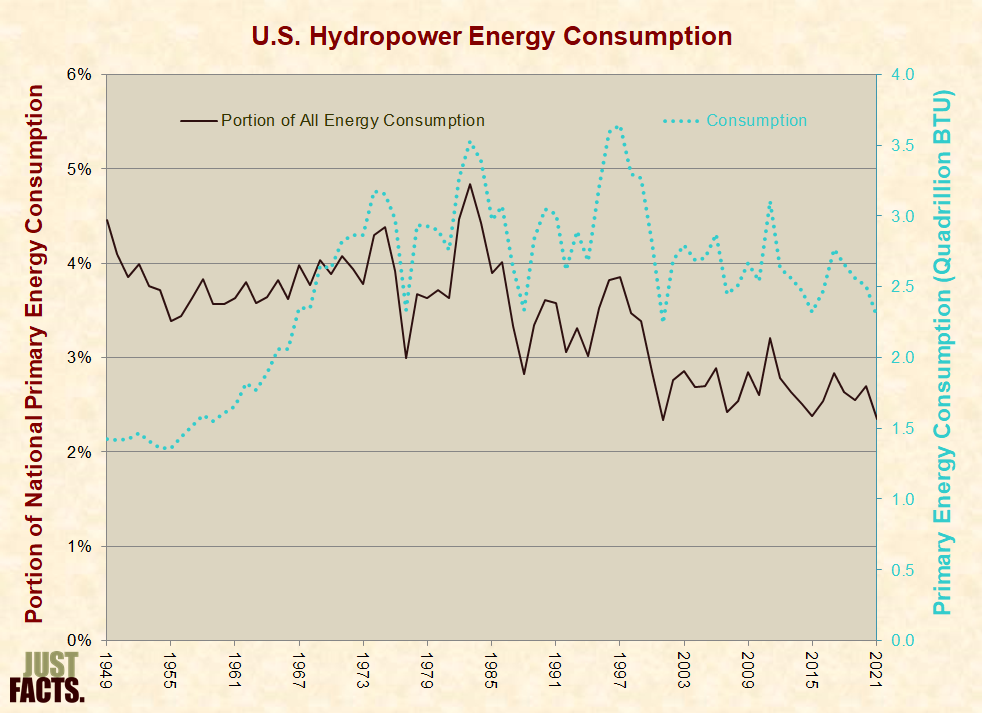
[767]
* In 2015, hydropower generated 6.0% of all electricity produced in the U.S.[768]
* Most large-scale hydroelectric power plants are built on rivers and use a dam to accumulate and release water. This allows the plant to generate varying amounts of electricity as the demand for electricity fluctuates.[769] [770] [771][772]
* Large-scale hydroelectric power plants that use dams can displace surrounding residents, impede the migration of fish, modify water temperatures, and cause other changes to river ecosystems.[773] [774] [775] [776]
* Per the U.S. Energy Information Administration’s Office of Energy Efficiency & Renewable Energy:
Research and development efforts have succeeded in reducing many of these environmental impacts through the use of fish ladders (to aid fish migration), fish screens, new turbine designs, and reservoir aeration.[777]
* Roughly 2-3% of the dams in the U.S. are used to generate hydropower. The rest are primarily used for recreation (35%), fish stock/farm ponds (18%), flood control (15%), public water supply (12%), irrigation (11%), and other uses (7%).[778] [779] [780]
* A 2012 analysis by Oak Ridge National Laboratory estimated that the U.S. could increase its hydropower generation by 15% through adding hydroelectric generators to existing non-powered dams [NPDs]. The analysis “did not consider the economic feasibility of developing each unpowered facility” but noted that:
* Hydroelectric power can also be produced without dams by “run-of-the-river” generators, which temporarily divert a portion of the river through canals or pipes that flow through turbines.[782]
* A 2006 analysis by Idaho National Laboratory estimated that U.S. rivers and streams have an average hydropower potential of 297,436 megawatts. The analysis also estimated that:
- 8% of this total potential is being harnessed.
- 33% of this total potential cannot be developed because of environmental and land use restrictions, lack of accessibility, or because it is located large distances from electrical power grids.
- 33% of this total potential could feasibly be developed.
- 8% of this total potential could be harnessed without using dams.
- 4% of this total potential could be harnessed without using dams and without using sites that have low-power potential, which makes them economically unattractive.[783] [784]
Wind
[786]
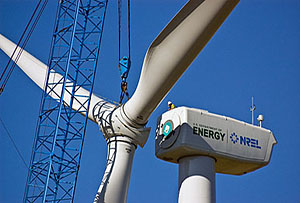
* More than 2,000 years ago, the Chinese used windmills to pump water. Around 600 A.D., Persians used windmills to grind grain.[787]
* From 1998 through 2015, the portion of U.S. primary energy supplied by wind grew from 0.03% to 1.9%:

[788]
* In 2015, wind generated 4.7% of all electricity produced in the U.S.[789]
* Ideally, commercial wind turbines should be located:
- where average wind speeds are at least 13 miles per hour.
- within short distances of electrical power grids.
- far enough away from humans to avoid noise pollution.
- in places with limited bird traffic.[790] [791] [792] [793] [794]
* Wind speeds fluctuate on an hourly, daily, monthly, and seasonal basis. In wind-rich areas, winds are sometimes not strong enough to drive turbines for days at a time.[795] [796] [797] Per the U.S. Energy Information Administration (EIA):
Even at the best sites, there are times when the wind does not blow sufficiently and no electricity is generated.[798]
Wind generators are subject to abrupt changes in wind speed, and their power output is characterized by steep ramps up or down.[799]
* Power capacity (a commonly cited statistic for wind energy installations[800]) is the amount of electricity that wind turbines produce when operating at full capacity, which occurs when wind conditions are optimal. It is not a measure of actual production.[801] [802] In the U.S. during 2004–2014, actual production from wind turbines was 29% of their power capacity.[803]
* With the exception of pumped hydropower, current technology cannot economically store large quantities of electricity. Thus, utilities must produce enough electricity to meet their customers’ demands on a second-by-second basis.[804] [805] [806] [807] [808] [809] [810]
* Because wind power is intermittent and utility-scale electricity cannot be easily stored, most wind power capacity must be backed-up by other energy sources that can generate electricity on demand, such as natural gas power plants.[811] [812] [813] [814] [815] [816] Per EIA:
Often, wind generation does not coincide with the demand for electric power; wind resources are generally more prevalent overnight, when demand for electric power is at a minimum. In most areas, summer peak demand for electricity coincides with hot afternoons when consumers have turned up their air conditioners – but in many areas, such times are calm and wind resources may be quite low.[817] [818]
* As the amount of wind capacity rises in a given region, so do the challenges and costs of backing up its intermittent energy output.[819] [820] [821] [822]
Solar
- thermal collectors, which capture sunlight and covert it to heat that can be used to warm items such as indoor air, tap water, and swimming pools.
- concentrating power systems, which use mirrors to focus sunlight in order to heat liquids that power electricity-generating steam turbines.
- photovoltaic (PV) cells, which use layers of semi-conductive materials (like silicon) to convert sunlight directly into electricity.[823] [824] [825] [826]
* In the third century B.C., Greeks and Romans used mirrors to concentrate solar energy for the purpose of lighting torches. In the late 1800s, a French mathematician built the world’s first solar-powered steam engine.[827]
* In 1953, three U.S. scientists built the world’s first silicon photovoltaic cell. This was the first photovoltaic cell that generated enough energy to power common electrical devices. One year later, Western Electric began selling commercial licenses for silicon photovoltaic technologies.[828]
* With the exception of nuclear and geothermal power, all major current energy sources ultimately derive from solar energy. Wind energy arises from sunlight heating the atmosphere, biofuels and fossil fuels are made of organic materials that were nourished by sunlight, and hydropower is driven by the hydrological cycle, which is powered by the sun.[829] [830] [831] [832]
* From 1988 through 2015, the portion of U.S. primary energy supplied by solar power grew from 0.0001% to 0.5%:

[833]
* In 2015, solar energy produced 0.9% of all electricity generated in the U.S.[834]
* From 1998-2011, the average reported installed price for residential and commercial PV systems declined by about 5-7% per year. Primarily, this was due to technological advancements, economies of scale, and federal, state and local government subsidies.[835] [836] [837] [838] [839] [840]
* In 2009, Jeffrey Punton of Rochester, N.Y., installed 20 solar panels at his home for a cost of $42,480. The federal government and state of New York paid for $29,504 or 69% of these costs.[841] Per a 2012 report by Lawrence Berkeley National Laboratory:
The market for PV in the United States is, to a significant extent, driven by national, state, and local government incentives, including up-front cash rebates, production-based incentives, renewables portfolio standards, and federal and state tax benefits.[842]
* Power capacity (a commonly cited statistic for solar energy installations[843]) is the amount of electricity that solar systems produce when operating at full capacity, which occurs when the sun is directly overhead, the solar panels are perpendicular to the sunlight, the sky is clear, and temperatures are low. It is not a measure of actual production.[844][845] [846] In the U.S. during 2004–2014, actual production from utility-scale solar systems was 17% of their power capacity.[847]
* With the exception of pumped hydropower, current technology cannot economically store large quantities of electricity. Thus, utilities must produce enough electricity to meet their customers’ demands on a second-by-second basis.[848] [849] [850] [851] [852] [853] [854]
* Because solar power is intermittent and utility-scale electricity cannot be easily stored, most solar power capacity must be backed-up by other energy sources that can generate electricity on demand, such as natural gas power plants.[855] [856] [857] [858] [859]
* As the amount of solar capacity rises in a given region, so do the costs of backing up its intermittent energy output.[860] [861]
Geothermal
- district heating systems, which heat buildings by piping in water from hot springs and reservoirs.
- power plants, which generate electricity through steam turbines that are powered by steam or superheated water typically piped in from a mile or two beneath the surface of the earth.
- heat pumps, which cool and heat buildings by transferring heat to and from the ground. In most places, the temperature of the earth at 10 feet underground stays between 50-60°F throughout the year. In the summer, heat pumps cool buildings by transferring their heat into the ground. In winter, heat pumps warm buildings by transferring heat from the ground into the buildings.[862] [863] [864] [865] [866]
* Since ancient times, people have used hot springs for bathing, cooking, and heating.[867]
* The world’s first electricity-generating geothermal plant was built in 1904 in Tuscany, Italy.[868]
* From 1980 through 2015, the portion of U.S. primary energy supplied by geothermal power grew from 0.07% to 0.23%:

[869]
* In 2015, geothermal generated 0.4% of all electricity produced in the U.S.[870]
* Electricity-generating geothermal plants are typically built at sites where geothermal reservoirs are not buried too deeply. In the U.S., such resources are mostly in the western states and Hawaii. [871] [872]
…..To be continued……


