(This is the fourth part in a series that brings to the reader some basic facts about energy so that he/she can better understand the raging debate over energy supplies and environmental stewardship.)
Energy Facts and Figures for Dummies Part IV
Natural Resources
* Estimates of crude oil resources are uncertain and subject to change, particularly for tight oil formations.[339] [340]
* Definitions used for estimates of fossil fuel resources include:
- proved reserves, which are known resources that can be profitably extracted at current prices with current technologies.[341] [342]
- technically recoverable reserves, which are resources that can be extracted with current technology regardless of economic viability.[343] [344] [345]
- undiscovered recoverable reserves, which are resources that are not yet discovered but are “estimated to exist in favorable geologic settings.”[346]
* Per EIA, it is “misleading” to make assessments about total fossil fuel resources on the basis of proved reserves. This is because:
Proved reserves are an accounting concept that is based on known projects, and it is not an appropriate measure for judging total resource availability in the long term. Over time, global reserves will likely increase as new technologies increase production at existing fields and as new projects are developed.[347] [348] [349] [350]
* In 1955, America’s proved reserves of oil were equal to 11-12 years of U.S. oil consumption at that time.[351]
* In 1977, the U.S. had 31.8 billion barrels of proved crude oil reserves. If this represented all U.S. crude oil resources, the U.S. would have run out of oil in 1988.[352]
* As of 2013, the U.S. Energy Information Administration (EIA) estimates that the U.S. has 260 billion barrels of technically recoverable crude oil. This figure does not include:
- oil shale.
- resources located in areas “areas where drilling is officially prohibited.”
- about 7 billion barrels of offshore oil located in areas that are not expected to be drilled by 2040.[353]
* 260 billion barrels of technically recoverable crude oil is roughly equivalent to:
- 76 years of U.S. crude oil production at the 2015 production rate.[354]
- 50 years of U.S. crude oil consumption at the 2015 consumption rate.[355]
* As of 2013, the U.S. Energy Information Administration (EIA) estimates that the world has 3,357 billion barrels of technically recoverable crude oil. This figure does not include several crude oil resources, such as offshore shale oil, shale oil formations in the Middle East and Caspian region, tight sandstone formations, and other formations that have not yet been quantified by EIA.[356]
* 3,357 billion barrels of technically recoverable crude oil is equivalent to 108 years of worldwide petroleum production at the 2010 production rate.[357]
* According to a 2009 estimate by the U.S. Department of Energy, worldwide oil shale reserves, which are not included in the above estimates of technically recoverable crude oil, are equivalent to about 3.7 trillion barrels of crude oil. In 2009, this was roughly 40% more than all other global reserves of petroleum. About two thirds of these oil shale reserves are located in the U.S.[358]
* In 2010, the U.S. Department of the Interior reported that roughly 45% to 80% of oil shale reserves may be technically recoverable.[359]
* The largest known oil shale reserves are located in the Green River Formation, which is situated in southwestern Wyoming, northeastern Utah, and northwestern Colorado.[360] [361]
* In 2013, the U.S. Department of the Interior reported that the Green River Formation contains about 4.3 trillion barrels of oil shale, and roughly 8% to 27% of this has “a high potential for development.”[362] This amounts to:
- 68 to 222 years of U.S. crude oil consumption at the 2015 consumption rate.[363]
- 103 to 334 years of U.S. crude oil production at the 2015 production rate.[364]
- 11 to 37 years of worldwide petroleum production at the 2010 production rate.[365]
* Per the U.S. Department of the Interior:
More than 70% of the total oil shale acreage in the Green River Formation, including the richest and thickest oil shale deposits, is under federally owned and managed lands. Thus, the federal government directly controls access to the most commercially attractive portions of the oil shale resource base.[366]
* Compiling the above estimates of technically recoverable crude oil and Green River oil shale with high potential for development:
- the U.S. has 0.6 to 1.4 trillion barrels of crude oil and oil shale reserves, which is equivalent to 112 to 265 years of U.S. crude oil consumption at the 2015 consumption rate.[367]
- the world has 3.7 to 4.5 trillion barrels of crude oil and oil shale reserves, which is equivalent to 119 to 145 years of worldwide petroleum production at the 2010 production rate.[368]
Natural Gas
* Natural gas is a mixture of fossil fuels (mostly methane) that are gaseous at atmospheric pressure and room temperature. Natural gas is sometimes defined differently because certain fossil fuels that are gases inside the earth become liquids when brought to the surface, and because certain natural gases (like propane) are commonly processed into liquids called natural gas liquids.[369] [370] [371]
* The U.S. Energy Information Administration (EIA) typically classifies natural gas liquids as petroleum. Therefore, the above data on petroleum production, consumption, etc. generally includes these natural gas liquids, and the corresponding data below on natural gas generally does not.[372]
* Natural gas is primarily comprised of organic compounds called hydrocarbons, which consist of carbon and hydrogen.[373]
* Natural gas is mainly thought to be formed of diverse marine organisms that were buried by sediments and transformed by heat, pressure, and time.[374] [375] [376]
* Natural gas and crude oil are often found in the same geological formations. In 2014, roughly 18% of all natural gas extracted from the ground in the U.S. came from crude oil wells.[377] [378]
* The first known natural gas well was drilled in China in 211 BC, and the gas was used for drying salt. The first North American natural gas well was drilled in Fredonia, N.Y., in 1821, and the gas was used for lighting and cooking.[379]
* The vast majority of natural gas is currently transported through pipelines. Prior to the early-to-mid 1900s, natural gas was not widely used because it was difficult to transport large amounts of it over long distances. Since then, advances in pipeline technology and infrastructure have made it economical to transport large volumes of natural gas in many circumstances.[380] [381] [382]
* In circumstances where pipelines are not practical or cost-effective (like when shipping overseas), it is more expensive to ship natural gas than crude oil, because the density of natural gas is 942 times less than crude oil. When shipping overseas, natural gas is often liquefied by cooling it to -258ºF (-161ºC), which reduces its volume by a factor of 610. During this process, about 8-10% of the gas is consumed to generate the energy to cool the gas to these subzero temperatures.[383] [384] [385] [386]
* Before the widespread construction of pipelines, natural gas produced from oil wells was often discarded through burning it (called flaring) or releasing it into the air (called venting).[387] [388]
* In 1949, 11.3% of natural gas extracted from the ground in the U.S. was vented or flared. By 1971, this figure declined to 1.2%, and since then, it has averaged 0.7%.[389]
* In 2014, 1.0% of U.S. natural gas production was vented or flared.[390] Worldwide in 2010, roughly 4.4% of natural gas production was flared (data on venting is unavailable).[391]
* Natural gas and natural gas liquids are combusted for purposes such as space heating, cooking, and electricity generation. Natural gas liquids are also used as ingredients in wide-ranging products, such as plastics, fertilizers, and detergents.[392] [393] [394] [395] [396]
* In 2015, natural gas supplied:
- 28% of all primary energy consumed in the U.S.
- 3% of primary energy consumed in the transportation sector.
- 39% of primary energy consumed in the industrial sector (not including energy purchased from electric power utilities).
- 76% of primary energy consumed in the residential and commercial sectors (not including energy purchased from electric power utilities).
- 26% of primary energy consumed in the electric power sector.[397]
Consumption, Production, Imports, and Prices
* In 2015, the U.S. consumed about 27.5 trillion cubic feet of natural gas, 3% of which was imported: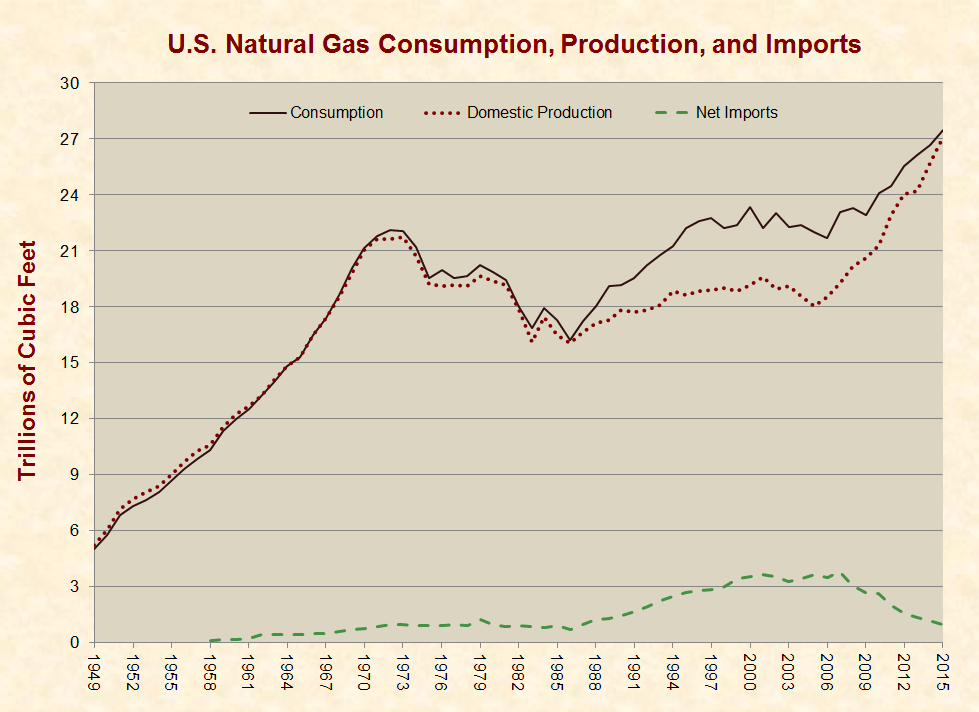
[398]
* Between 2007 and 2015, the portion of U.S. natural gas consumption that was imported declined by 79%, primarily as a result of increased domestic production through technologies known as horizontal drilling and hydraulic fracturing (described below):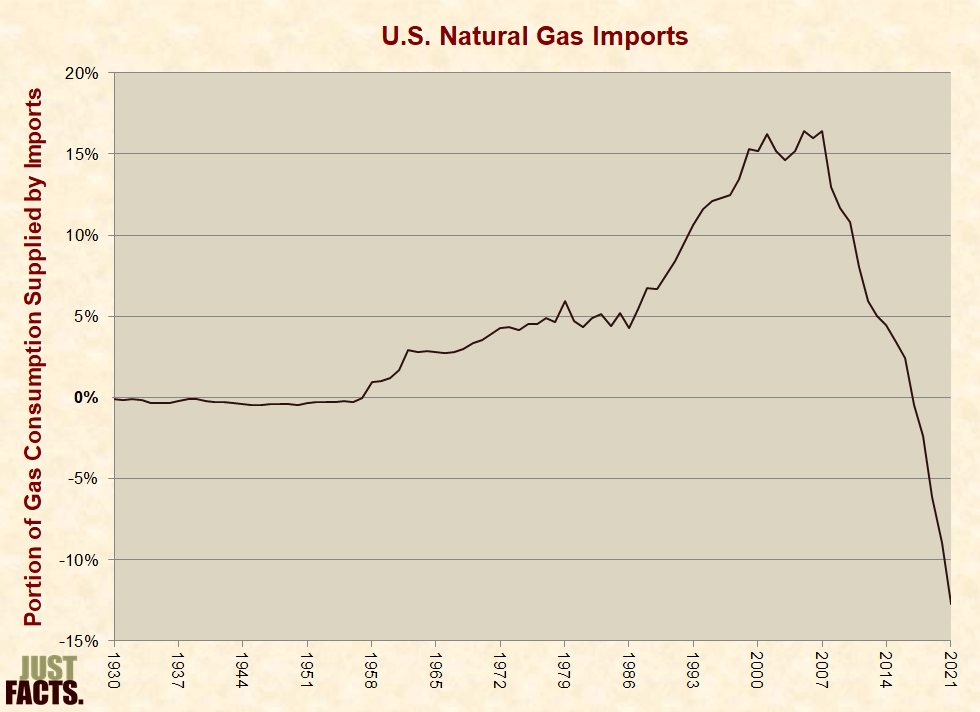
[399] [400] [401] [402]
* Natural gas prices are affected by factors that impact supply and demand, such as economic growth and recessions, weather, and technological advancements.[403] [404] [405] [406] Because natural gas is more difficult to transport than petroleum, natural gas prices are more affected by local and regional factors than petroleum prices, which are primarily driven by global factors.[407] [408] [409] [410] [411]
* In 2015, the average production price for natural gas was roughly $2.99 per thousand cubic feet, and the average price for residential consumers was $10.38 per thousand cubic feet.[412]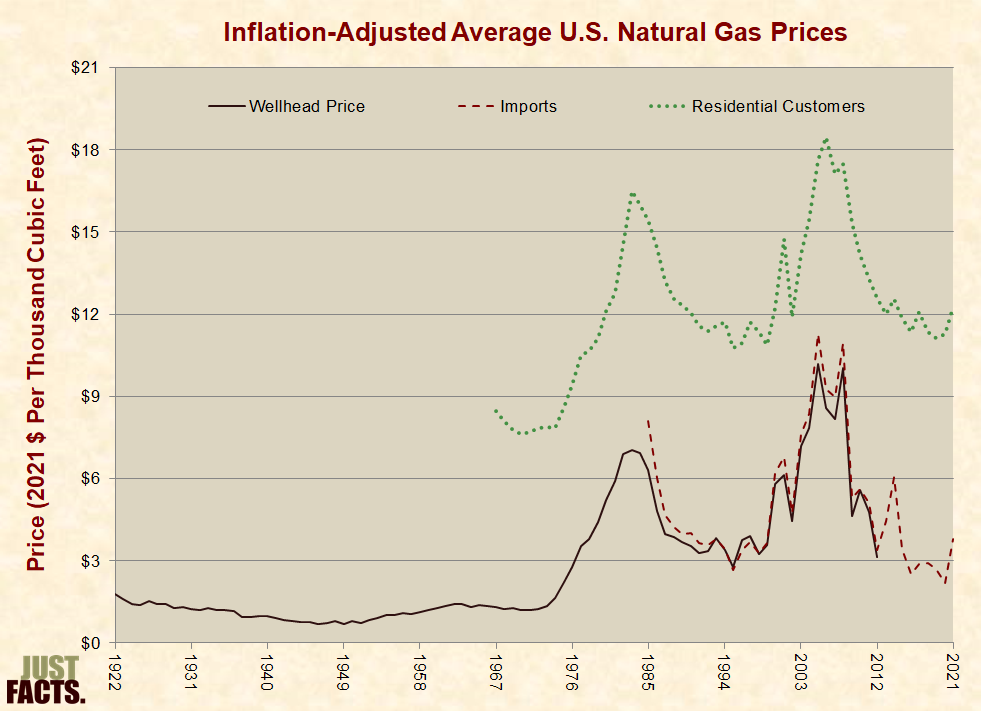
[413] [414]
Electricity
* In 2015, natural gas supplied 26% of the primary energy consumed in the U.S. electric power sector.[415] Because certain natural gas power plants are more efficient than coal power plants,[416] [417] and because some electricity is generated outside of the electric power sector, during 2015 natural gas supplied:
- 32% of the electricity produced in the electric power sector.[418]
- 33% of the electricity produced in all sectors.[419]
* Demand for electricity varies on an hourly, daily, and seasonal basis due to factors such as:
- the time of the day, which influences the usage of lighting, computers, and other electric devices.
- the weather, which influences the usage of heating, air conditioning, and ventilation systems.[420] [421] [422]
* As shown in the following graph, the terms “baseload” and “peak load” are used to describe the minimum and maximum demands for electricity over a given time period. The term “intermediate load” is used to describe the range between them.[423] [424]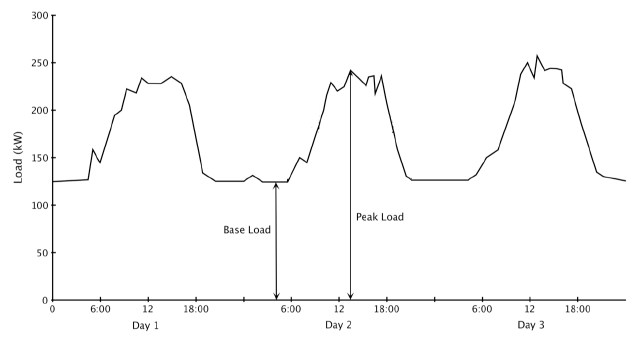
[425]
* Natural gas is the dominant energy source for generating intermediate and peak load capacity because:
- natural gas power plants can ramp up and down quickly, which is ideal for intermediate and peak load capacity.
- natural gas power plants are less expensive to build than coal and nuclear power plants.[426] [427] [428] [429]
* Coal is the dominant energy source for generating baseload capacity because once built, low fuel costs make coal plants inexpensive to run continuously, which is ideal for generating baseload capacity.[430] [431] [432]
* In 2009, natural gas became competitive with coal for generating baseload capacity in some areas of the U.S. This was primarily due to increased domestic natural gas production, which reduced prices. Other factors included increased coal prices, stricter environmental regulations, and expansion of natural gas pipelines.[433] [434] [435] [436]
* In 2012, both coal and natural gas fuels were competitive for generating baseload capacity under differing circumstances in different regions of the U.S.[437]
* Due to their higher efficiency, natural gas power plants that employ a technology called “combined cycle” can generate baseload power less expensively than coal plants when natural gas is about 1.5 times the price of coal.[438] [439] [440] In 2015, the average energy-equivalent price paid by electric power plants for natural gas was about 1.5 times the price of coal.[441]
To be Continued …


