(Editor’s note: Just Facts is a neat publication that has produced some very worthwhile information that we have shared with the readers of the Jefferson Policy Journal over the years. Its newest research deals with the facts of energy and will be reprinted here over the next several issues. There are pages and pages of footnotes and if a reader would like these, please email me and I will gladly send you the link to them. They are simply too numerous to reprint in this public policy journal. I hope you enjoy this series.)
Introductory Notes
In keeping with Just Facts’ Standards of Credibility, all graphs show the full range of available data, and all facts are cited based upon availability and relevance, not to slant results by singling out specific years that are different from others.
Science and Economics
Basic Science
- “Energy,” as defined by the Oxford Dictionary of Biochemistry and Molecular Biology, is “the capacity of a system for doing work.”
- Energy can take varying forms, such as thermal, electrical, mechanical, nuclear, chemical, gravitational, acoustic, and electromagnetic.
- Two common measures of energy are British thermal units (Btu) and joules. All forms of energy can be expressed in these units. One Btu is the amount of energy needed to raise the temperature of one pound of water from 39 to 40 degrees Fahrenheit.One joule is the amount of energy needed to lift one hundred grams (3.5 ounces) upward by one meter (3.3 feet) while on the surface of the earth.[6]
- As a consequence of the First Law of Thermodynamics, energy and matter cannot be created or destroyed; they can only be transformed from one form into another.[7] [8] [9] [10]
- As a consequence of the Second Law of Thermodynamics, when energy is transformed from one form to another, some of it disperses, thus making it less useful for performing work. [11] [12] [12] [14]
Practical Uses
- Humans have learned to harness energy to accomplish tasks such as transporting people and products, heating and cooling homes, farming, cooking, manufacturing goods, communicating across vast distances, and generating light. [15]
- The average annual energy consumption in the U.S. is 309,000,000 Btu per person. To generate this amount of energy through physical human effort (like pedaling bicycles to drive generators) would require 208 people working nonstop for a year. [16]
- “Embodied energy” refers to the energy used in making materials. For example, to make a common clay brick weighing 5 pounds requires about 5,386 Btu of energy. The materials of a typical house embody about 850 million Btu, which is equivalent to the energy that would be generated by 573 people pedaling bicycles nonstop for a year. [17]
Economic Impacts
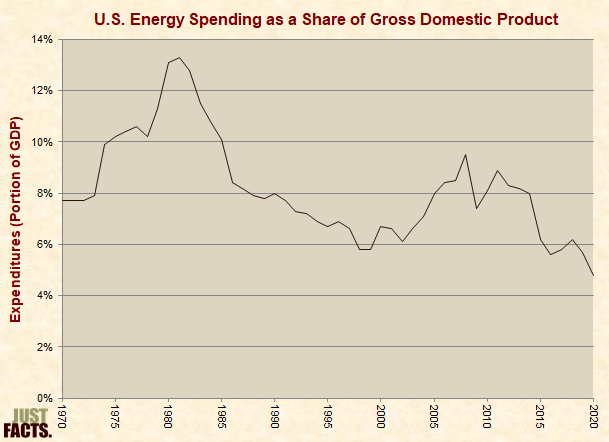
The costs of most products are affected by the costs of energy, even products with low embodied energies because the costs of energy affect the costs of transporting products. Because energy costs influence the costs of products, higher energy costs tend to drive up unemployment, drive down wages, and cause other negative economic effects. Such consequences tend to be harsher in poorer nations.[23] [24] [25]
Roughly one third of the world’s population does not have access to modern forms of energy. In these areas, people use biomass (primarily wood) for about 80% of their energy, and women and children spend an average of 9-12 hours a week collecting firewood. Per the Institute for Plasma Physics in the Netherlands:
Poor people spend a large part of their time collecting the energy they need. This time cannot be spent in producing things that can be sold, working on the land, or learning. This is called the poverty trap: once you are poor, it is very hard to get out of poverty again, because you need to spend all your time in survival activities. This normally leaves very little time to do things that might get you out of poverty, like education, or production of goods to sell on the market.[26] [27]
- Higher energy costs drive up the costs of food.[28] This has greater impacts on poorer nations and individuals because they spend a larger portion of their income on food.[29] [30] In Haiti during 2007 and 2008, higher energy prices contributed to increased food prices, driving Haiti’s poorer people to obtain nourishment from cookies made of mud.[31]
- Per the Congressional Research Service, “The economic well-being and economic security of the nation depends on having stable energy sources.”[32]
- Per the U.S. Government Accountability Office, “Americans’ daily lives, as well as the economic productivity of the United States, depend on the availability of energy….”[33]
- Per the textbook Introduction to Air Pollution Science, “The availability of affordable electric power is essential for public health and economic prosperity.”[34]
Per the U.S. Energy Information Administration:
- “Liquid fuels play a vital role in the U.S. energy system and economy, and access to affordable liquid fuels has contributed to the nation’s economic prosperity.”
- “Cheaper energy allows the economy to expand further….”
- “increasing energy production has immediate benefits for the economy.”[35] [36]
- Per the textbook Microeconomics for Today, countries with slower economic growth “are less able to satisfy basic needs for food, shelter, clothing, education, and health.”[37]
U.S. Energy Supplies
During 2015:
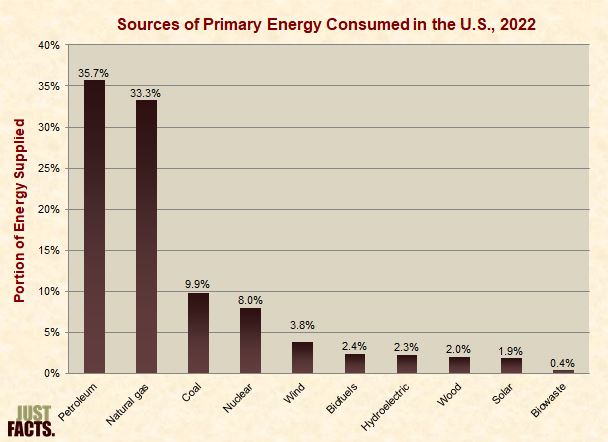
- Petroleum supplied 36.2% of all primary energy consumed in the U.S.
- Natural gas supplied 29.0%.
- Coal supplied 16.1%.
- Nuclear supplied 8.5%.
- Hydroelectric supplied 2.4%.
- Biofuels supplied 2.2%.
- Wood supplied 2.1%.
- Wind supplied 1.9%.
- Solar supplied 0.5%.
- Biowaste supplied 0.5%.
- Geothermal supplied 0.2%.[38]
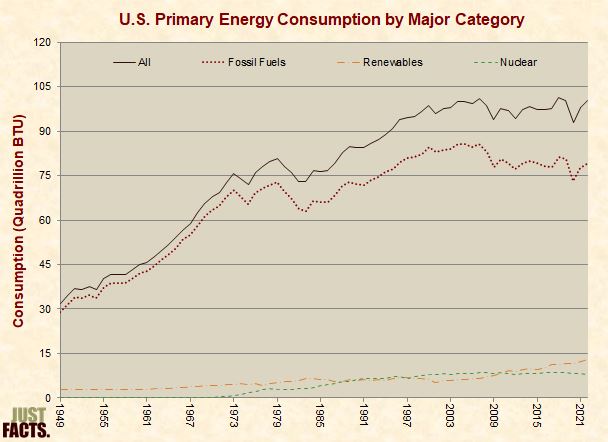
- The following graphs show the components of U.S. energy consumption over time. The first graph shows consumption measured in BTUs. The rest show consumption measured as a portion of total U.S. energy consumption. Each succeeding graph uses a smaller scale to provide increasing resolution.
- The following graphs show the components of U.S. energy consumption over time. The first graph shows consumption measured in BTUs. The rest show consumption measured as a portion of total U.S. energy consumption. Each succeeding graph uses a smaller scale to provide increasing resolution.
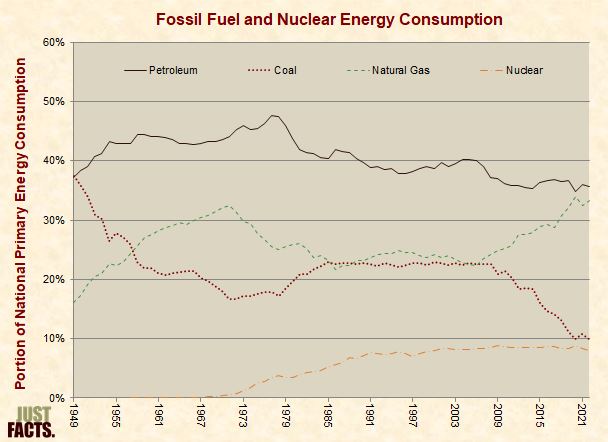
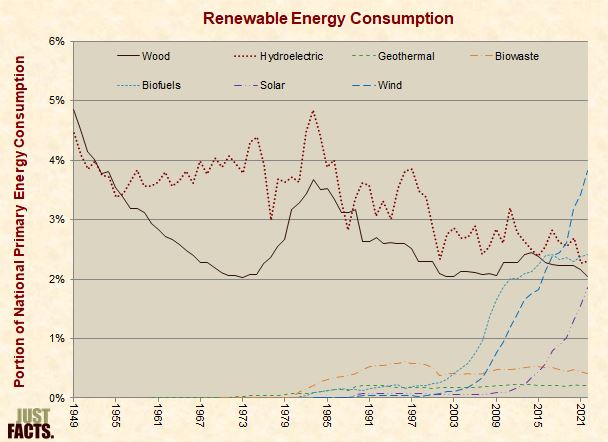
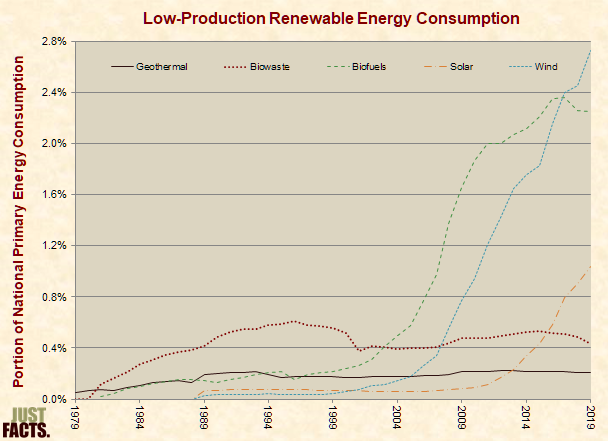
* Data from the graphs above:
|
Components of U.S. Energy Consumption | ||||||||
|
Source |
1950 |
1960 |
1970 |
1980 |
1990 |
2000 |
2010 |
2015 |
| Petroleum |
38.5% |
44.2% |
43.5% |
43.8% |
39.7% |
38.7% |
36.4% |
36.2% |
| Natural Gas |
17.2% |
27.5% |
32.1% |
25.9% |
23.2% |
24.1% |
25.2% |
29.0% |
| Coal |
35.7% |
21.8% |
18.1% |
19.8% |
22.7% |
22.8% |
21.4% |
16.1% |
| Nuclear |
0.0% |
0.0% |
0.4% |
3.5% |
7.2% |
8.0% |
8.7% |
8.5% |
| Hydroelectric |
4.1% |
3.6% |
3.9% |
3.7% |
3.6% |
2.8% |
2.6% |
2.4% |
| Biofuels |
N/A |
N/A |
N/A |
N/A |
0.1% |
0.2% |
1.9% |
2.2% |
| Wood |
4.5% |
2.9% |
2.1% |
3.2% |
2.6% |
2.3% |
2.0% |
2.1% |
| Wind |
N/A |
N/A |
N/A |
N/A |
0.0% |
0.1% |
0.9% |
1.9% |
| Biowaste |
N/A |
N/A |
0.0% |
0.0% |
0.5% |
0.5% |
0.5% |
0.5% |
| Geothermal |
N/A |
0.0% |
0.0% |
0.1% |
0.2% |
0.2% |
0.2% |
0.2% |
| Solar |
N/A |
N/A |
N/A |
N/A |
0.1% |
0.1% |
0.1% |
0.5% |
Sectors & Electricity
- The U.S. Energy Information Administration (EIA) divides the energy market into four major sectors: residential,[47] commercial,[48] transportation,[49] and industrial.[50] [51]
- In 2014, the residential sector consumed 22% of all U.S. energy, the commercial sector consumed 18%, the transportation sector consumed 28%, and the industrial sector consumed 32%.[52]
- EIA sometimes classifies “electric power” as separate sector,[53] although the electricity produced by this sector is consumed by the four major sectors.[54]
- In 2014, the electric power sector consumed 39% of all U.S. energy.[55]
- Per the Institute for Plasma Physics in the Netherlands:
- “Electricity is the most flexible form of energy: it can be used for virtually any application.”
- Using electricity to generate heat “is normally much more expensive than using fossil fuels, and it is only used for relatively small amounts of heat.”
- “Electricity is also quite hard to store in large quantities. You need large, heavy batteries to store a reasonable amount of electrical energy.”
- “The central generation of electricity means it has to be distributed over the country in order to bring it to your house. This causes an average loss of energy of 10%, and needs a large and expensive distribution system.”[56]
* During 2015:
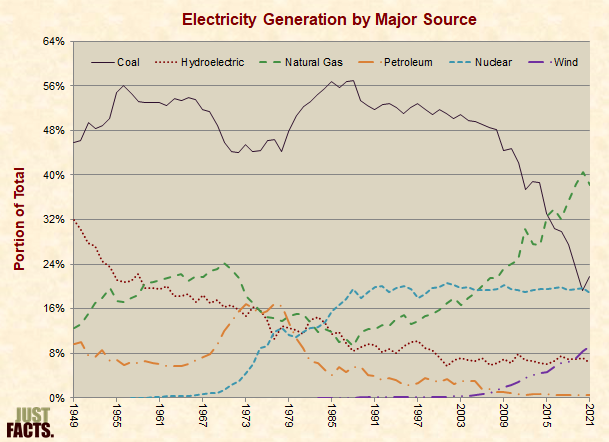
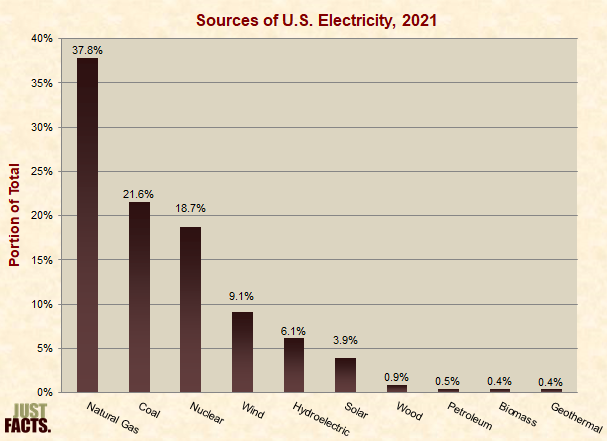
- Coal generated 33.2% of all electricity produced in the U.S.
- Natural gas generated 32.7%.
- Nuclear generated 19.5%.
- Hydroelectric generated 6.0%.
- Wind generated 4.7%.
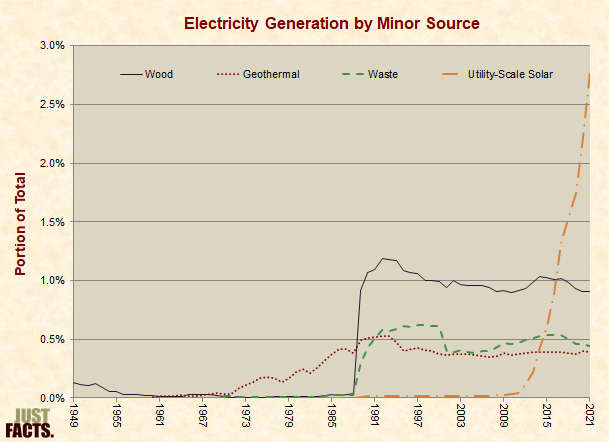
- Wood generated 1.0%.
- Solar generated 0.9%.
- Petroleum generated 0.7%.
- Biomass (other than wood) generated 0.5%.
- Geothermal generated 0.4%.[57]
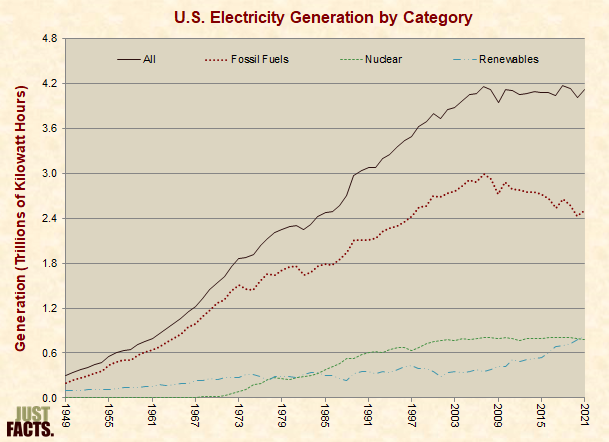
Economic growth is a key factor in the growth of electricity generation.[59]
The following graphs show the components of U.S. electricity generation over time. The first graph shows generation measured in kilowatt hours. The rest show generation measured as a portion of total U.S. electricity generation. Each succeeding graph uses a smaller scale to provide increasing resolution.
